General Market Overview – 8/28/16

August 28, 2016

All major indicies except RUT recorded a negative week after FED induced some fears of rate increase, atleast two by end of this year.

SPX: -.68%, COMP: -.37%, DOW: -.85%, RUT: +.10%

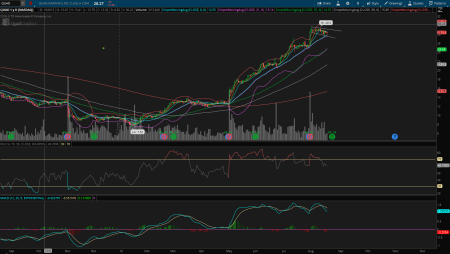
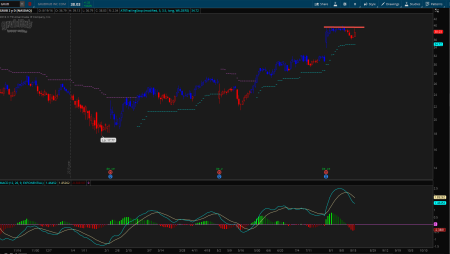
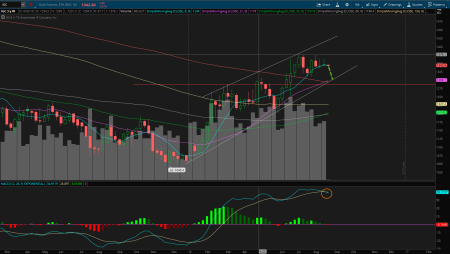
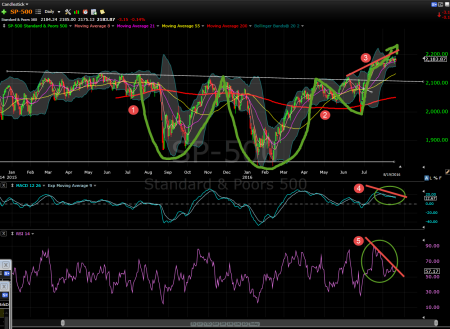
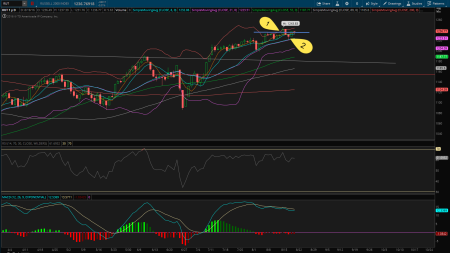
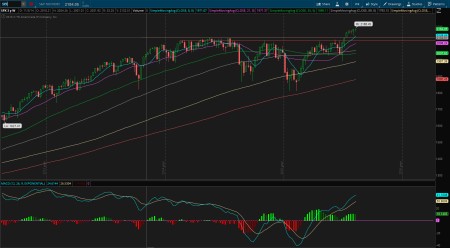
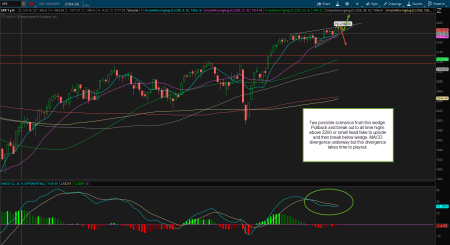
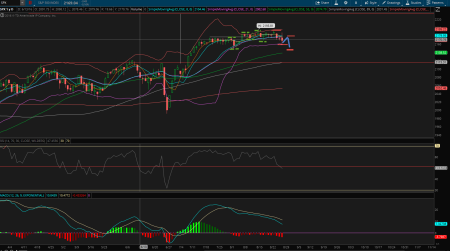
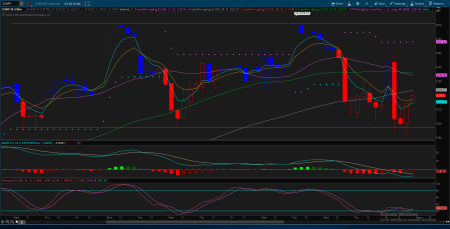
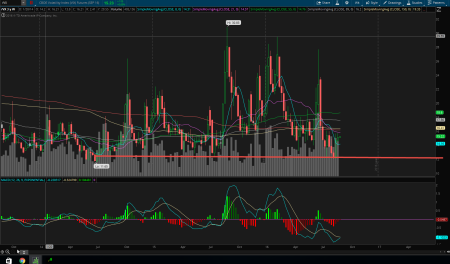
On the daily SPX chart below, I have drawn two boxes to mark price momentum. Price broke into the second box making new highs at 2193.81, then pulled back to the support area which was top of the box marked 1. Price bounced as expected but failed to make new highs. This is a first sign of crack in the bulls armor.

2016-08-28_16_SPX_D

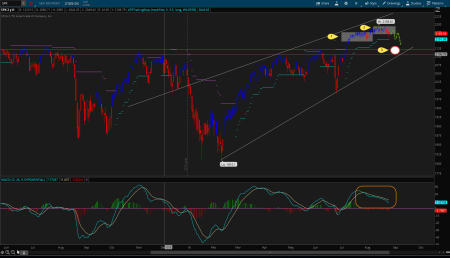
MACD confirming a downward momentum with MAs widening after Friday’s move.

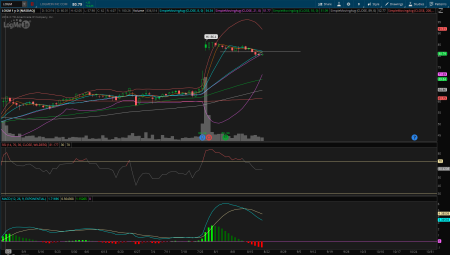
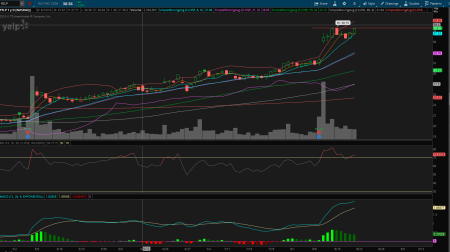
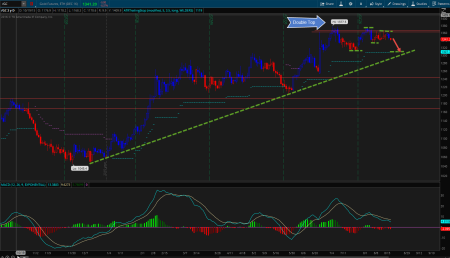
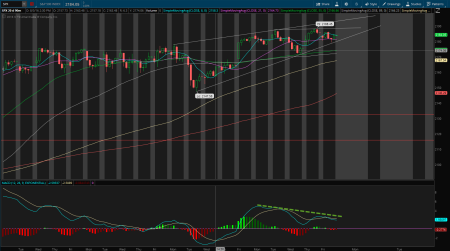
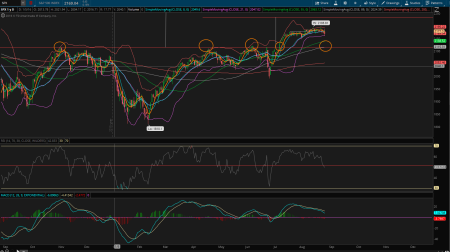
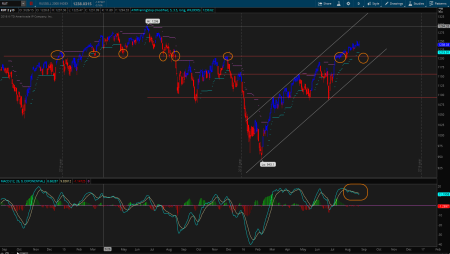
Another closer view of daily SPX purely on price action basis. To me a bullish price action is when price makes higher highs and higher lows. When price fails to make new highs after a bull run but instead makes a lower high and lower its time to pay attention that price momemntum has started shifting. That does not make a case to go outright bearish, but the price momentum shift indicates that new highs might not be in cards for a while. Price is most likely to go sideways to down.

On this chart higher highs and higher lows are marked in dotted green and lower lows and lower highs are marked red.

2016-08-28_SPX_D_2.png

Also two things to note on the above chart.

  1. Bollinger Band is now narrowing suggesting possible increase in volatility
  2. Price closed below 5, 8 and 21 MA. That possibly makes those MAs as potential resistance areas and next support would be the 55 MA (green).

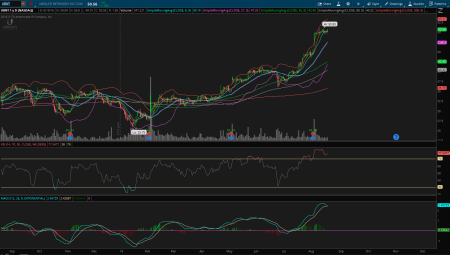
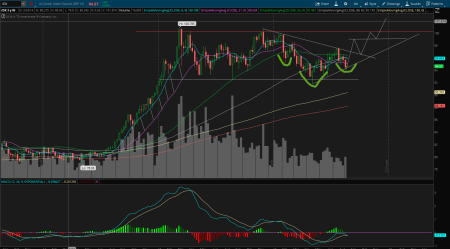
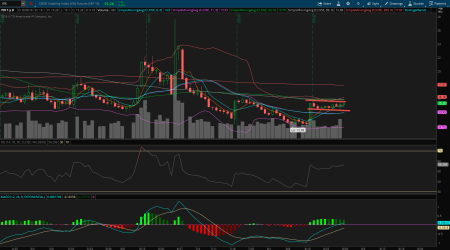
The below chart shows where price broke out on spx (circled). That area has a high probability of revisit and that could also mark a potential buy area for swing.

2016-08-28_SPX_3.png

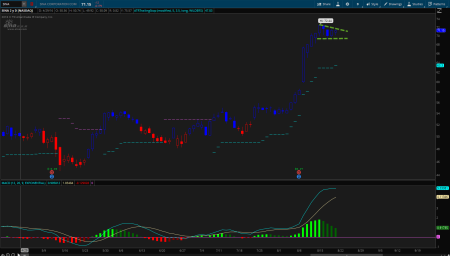
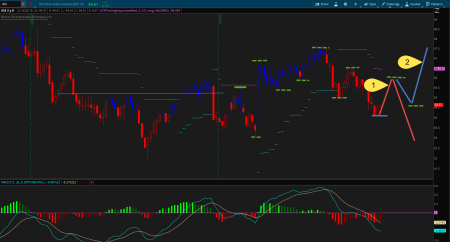
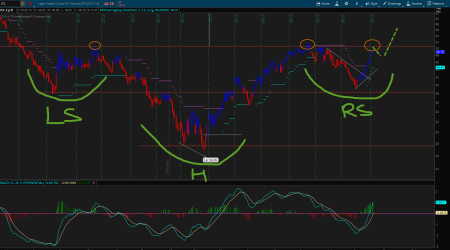
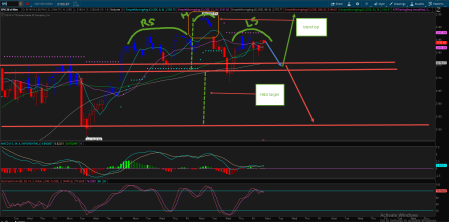
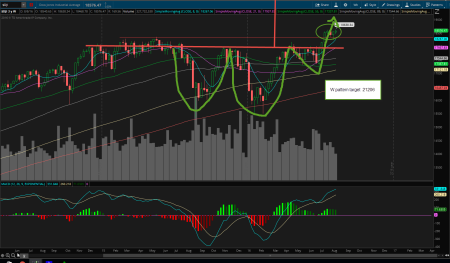
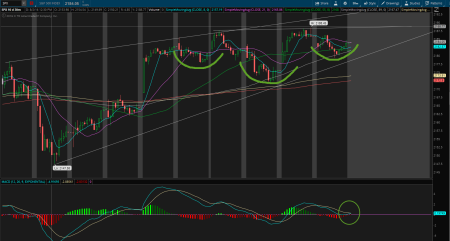
Usually when markets try to make a bullish/bearish moves they tend to develop bullish/bearish patterns in shorter time frames. On the 90min chart below SPX is currently underway to complete a H&S pattern.

2016-08-28_SPX_4

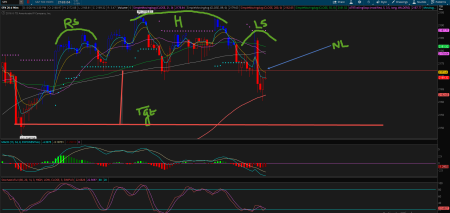
Price closed right below neckline (NL) on Friday. A break below 2160 will see this target acquired successfully and a break above 2182 will negate this pattern and bulls take control over this choppy zone again.

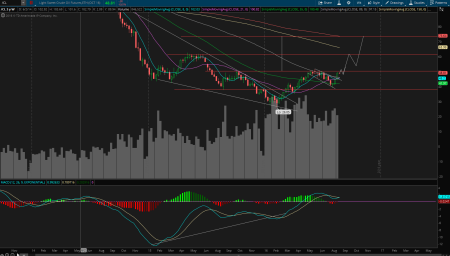
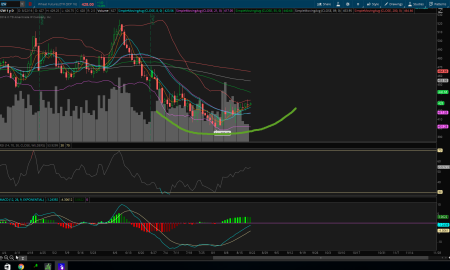
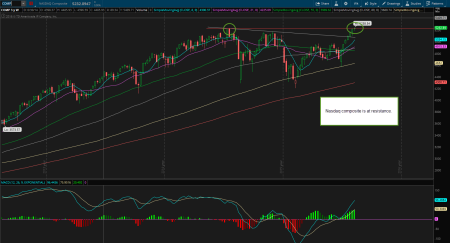
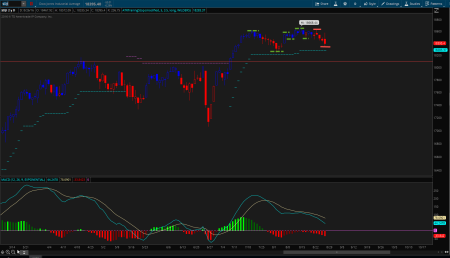
Nasdaq composite shows a possible double top with price testing lower range of the current price consolidation range.

2016-08-28_COMP_D.png

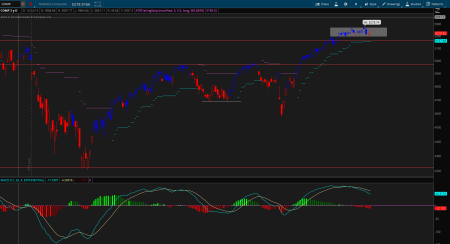
A closer look at the price action  on the double top and support/resistance levels.

2016-08-28_COMP_D2.png

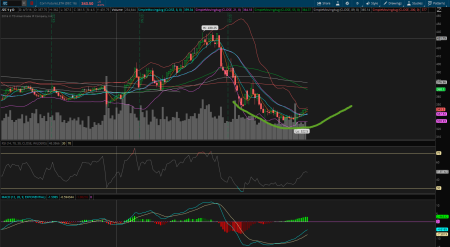
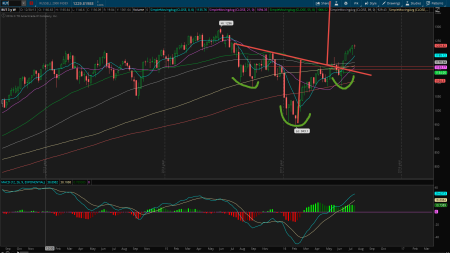
Potential double top with lower low and lower high confirmation on  Dow.

2016-08-28_DOW_D

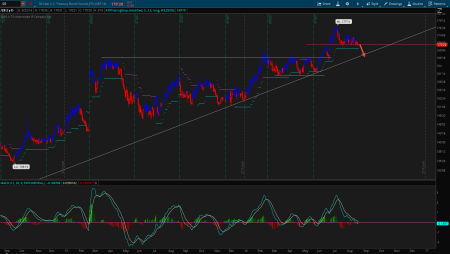
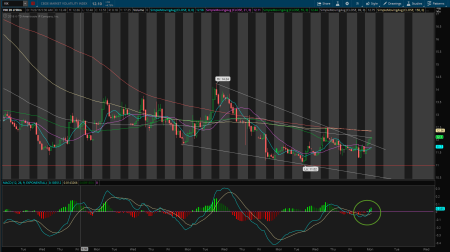
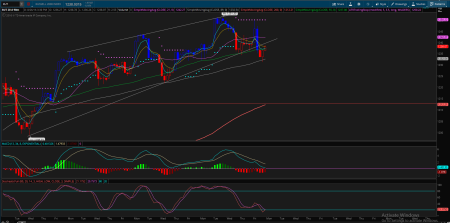
Russell was relatively strong last week and managed to close in green.  Daily RUT chart below shows the major support and resistance level for RUT. MACD also confirming a potential double top underway similar to other indicies.

2016-08-28_RUT.png

A closer look at RUT’s price action (90m chart) shows a possible break of TL.

2016-08-28_RUT_90m.png

Market Internals:

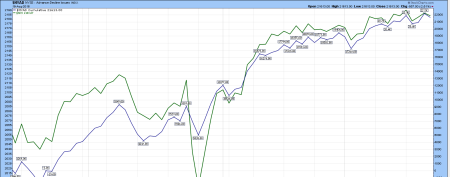
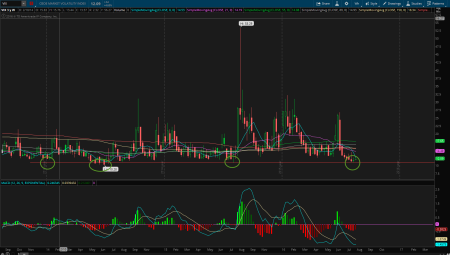
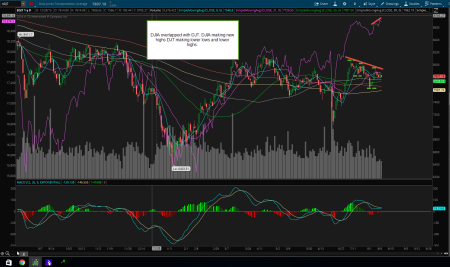
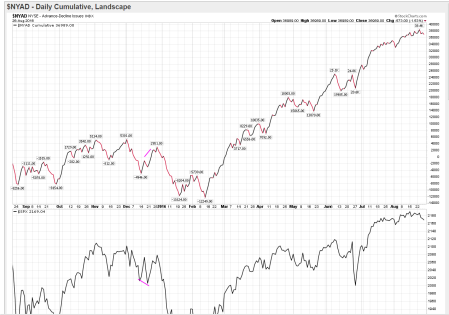
NYSE (Advance decliners) shows a potential pullback is currently underway. NYAD was -12K on Feb lows and now topped at 38K. Both Price and NYAD confirming the pullback.

2016-08-28_NYAD

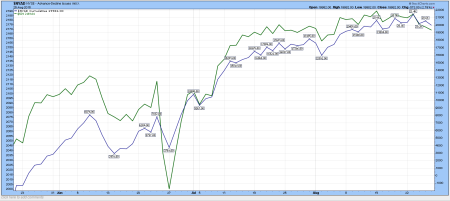
NYAD a much closer look with SPX overlap. Price action is leading to downside. If most of market leaders start rolling over then AD will catchup and will start leading to downside.

2016-08-28_NYAD2

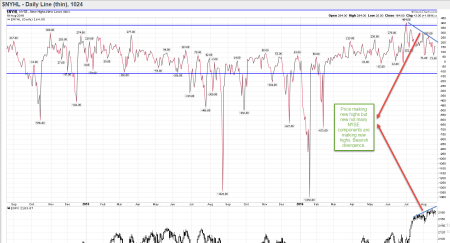
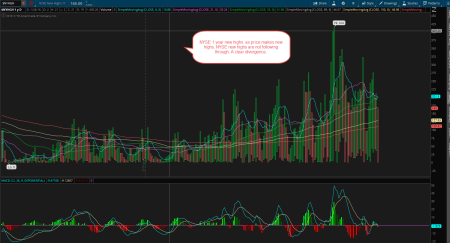
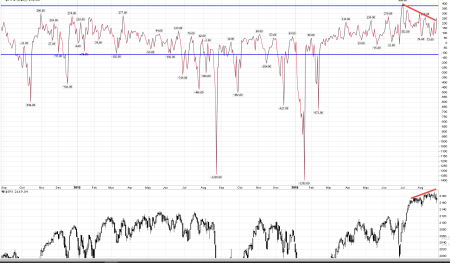
NYSE New high and New Low shows a divergence. When price made new highs, stocks were not making new highs.

2016-08-28_NHL.png

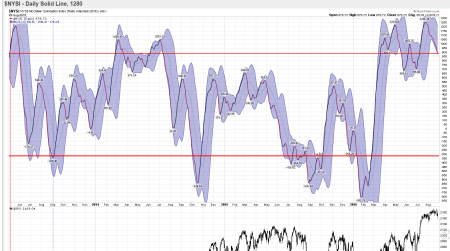
NYSE McClellan Summation index also confirming a down move. Break below 700 level will will see price go down further.

2016-08-28_MSI.png

Weekly Vix showing that some fear is creeping in and put protection is being bought. Support at 12 held. One thing to note is that when markets made new highs, Vix never made new lows.

2016-08-28_VX.png

Daily Vx futures showing a bull flag pattern is underway.

2016-08-28_VIX_D.png

Sector update:

Almost all sectors finished in red except for Financials. With a possibility of interest rate raise Financials sector rose as they end up making more money with higher interest rates. On contrary Utilities loose the most on a raising interest rate environment.

Best performing sector

Financials (xlf) : .42%

Worst performing sectors

Healthcare (xlv): -1.73%

Utilities (xlu): -2.23%

Outlook for next week: August is almost over and volatility seems to be coming back into the markets. Friday saw one of the widest price ranges (+27 pts)  after 2 weeks of tight trading range.

With Fed hinting at rate increases as a possibility, markets might go into a much needed pullback in September. SPX triggered a bearish H&S pattern and a successful test of target could give bears the much needed ammunition to press it down further.

I’m expecting more of a sideways to down with 2150 as next possible SPx target followed by 2116 which was the breakout area. For this bull market to continue price should break above 2184 area with heavy volume.

Have a great weekend and good trading.


Stocks Setup 08/21/2016

August 22, 2016

Bullish:

QUAD: Narrow range consolidation after earnings rally. HTF pattern. Break above 28.60 is a buy with stops below 27.55

2016-08-21_quad.png

LOGM: HTF pattern and 20DMA support. Break above 81.61 is a buy.

2016-08-21_logm.png

UBNT: Narrow range consolidation. Break above 50.83 is a buy.

2016-08-21_UBNT.png

SINA: Bullish consolidation. Price needs to consolidate a bit more here and any break above 72 is a buy.

2016-08-21_SINA.png

GRUB: Buy above 38.98

2016-08-21_GRUB.png

YELP:  buy above 38.75

2016-08-21_YELP.png

Other bullish stocks to watch:

EGRX,  ZEN (triggered buy), MNK, DGI, PE, MELI, CHGG, DKS (Above 60.40), TRN, CME, NTAP, EW, WMGI, ZION, WWW, QCOM, WLK, EOG. DV

Bearish Stocks:

WFM, AMT, FOXA, CBI, DHI, GGP, HAS, WFM, STLD, NUE, GOLD, GKOS, RYI, RS, X, MCRB, SSS, BMRN, PSA, ESPR,


Commodities Newsletter 08/21/16

August 22, 2016

Dollar:

Weekly  price testing trendline support. If price holds here, could trigger a inv h&s that could take out to new highs.

2016-08-21_Dollar_W.png

On the daily chart below, currently we see lower lows and lower highs, we need to see a higher low and higher high as an confirmation for pattern change. I have listed two possible scenarios.

  1. Price rallies to create another lower high and a new lower low
  2. Price rallies to create a lower high and then a higher low for trend reversal

2016-08-21_Dollar_D.png

Until price makes this transition there is no trade. Just monitoring.

Gold:

Gold trading in a channel. Weekly chart below shows last two weeks of price reversal. Break below last weeks low could see Gold testing 1300 level.

2016-08-21_Gold_W.png

On Daily chart below you can see the double top at 1377.5 and the subsequent rally could not break into new highs and infact price looks like wants to confirm lower lows and lower highs. Price could target the lower TL at 1300-1307. Short Gold below 1340 with stops above 1350.

2016-08-21_Gold_D.png

Silver is weaker than Gold and already has broken the lower levels to complete a lower low move.


Crude Oil:

On weekly chart, price broke a nice a bull flag pattern and forming potential inv H&S with target of $73. Neckline at $50 could act as another resistance level,but any break above this is a buy to first target of $60-$62 and then to $73.

2016-08-21_Oil_D.png

Here’s a daily chart of crude that shows a closer look of inv h&S and neckline.

2016-08-21_Crude_D


Bonds:

30-year treasury bonds are consolidating here with price trading below all key fast MAs (5, 8, 21, 50). Price looks like it would resolve lower. With bonds going lower yields will go higher which will help financial sector, which in turn would be good for the general market. With Semis leading tech and both financials and energy sector seems bullish it will also help us to see overall market trading to new highs.

2016-08-21_Bonds_D.png

Both Corn and Wheat seems like its forming a base here and could resolve higher.

2016-08-21_20_Wheat_D.png

2016-08-21_Corn_D.png

Have a great weekend and good trading!!


General Market Review 8/21/16

August 21, 2016

Market continued with its 4th week of consolidation fursturating both bulls and bears equally. For the week

Spx: -.01%, COMP: +.10%, Dow -0.1%, RUT: +.57%

Russell was the outperformer for the week and still catching up to other indices. While all other indices have broken to new highs, Russell still have another 50+ points to enter into new highs.

What’s interesting is that every day over the past week, SPX inches up to make new highs and then roll back over with some liquidation breaks and then the cycle repeats. I was expecting a gap up and go scenario but bulls seems weak here as well as they allow these liquidation breaks to occur on a daily basis. Bears also try to short this market but not getting paid to keep their shorts as markets inches its way up to make new highs.

This August consolidation period will resolve either to up or downside and honestly that’s something no one can predict. Bulls could argue that price consolidation is a good sign at these all time highs and price will eventually move its way up for further gains. Bears could argue that while prices are making these attempts at new highs there are lot of divergences which would further cap any upside move and divergences will play out eventually to down side.

Below is the snapshot of daily SPX that both bulls and bears can argue their case.

2016-08-21_SPX_D

Bull Case: The W pattern that’s indicated by 1 and cup and handle pattern triggered at 2 are both alive and well. Price is still trading above the neckline and as long as price trades above those levels this bull market is intact and we could see the target at 2402.

Bear Case: When price is making new highs at 3 after triggering the neckline both MACD (4) and RSI (5) are making lower highs confirming a negative divergence.

Lets look at  some lower time frames to see whether we see any bullish or bearish patterns emerge in those time frames.  Looking at the 90m chart below, on 8/15 price gapped up after several days of consolidation post NFP (non-farm payroll) gap. Price on that day made new highs to 2193.81 but never was able to close at highs.

2016-08-21_SPX_90_M.png

And the following day price gapped down creating an island top. Island tops are usually bearish patterns that resolve to the downside. It indicates that price was auctioned higher due to some heavy buying at open but never found sustaining bulls to keep price higher at close. And when the following day price auctions lower all those bulls who bought the prior day will have to close their positions causing a liquidation break which will attract sellers.

The net result of all these back and forth price action is a H&S top. A break below 2172 will trigger the h&s pattern with a target of 2151 thus closing the NFP gap.  On the contrary if price breaks above 2188 level it will negate this pattern and price will attract new net buyers to create new highs. Next week will be interesting to see which of this scenario plays out.

Russell looks like a potential double top

2016-08-21_RU_D.png

At (1) price broke above the prior resistance and any throwback should be defended at that break out level, which is 62% fib level. But price broke below (marked by (2))  the low of bar marked (1) (the breakout bar) which is usually not a bullish sign. However price find support at 21 DMA and bounced off that level. Any break below that 21 day MA or the low of (2) could be shorted with lower Bollinger band as target.

Market Internals: Lets look at some of the market internals and see whether we see divergences.

NYSE – New Highs – New Lows diverging from recent price action. SPX new highs in black below diverging with NYSE.

2016-08-21_NYHL.png

NYAD not showing much of divergence. Infact AD made new highs while SPX made lower high.

2016-08-21_NYAD

What to look for next week:

Even though we see divergences between price and indicators, divergences take a long time to play out and sometime wont even play out as indicators will snap back to catch up to price. Price action is the ultimate indicator and based on that I see the following

  1. Each dip is being bought and price consolidated at new highs.
  2. New H&S at 90 min chart above will give signal towards the next move.
  3. Break above 2188 is a buy and break below 2172 will be a short.
  4. Both bullish or bearish trades now should be focused more on short term basis as opposed to buy/sell for a longer time frame
  5. Trade shorter time frames and take quicker profits until this consolidation resolves with wider price ranges.

I’m also going start posting commodities and stock setup newsletter each week to give a wider prespective of the market and look at some good stock setups.

Have a great weekend and great trading next week.


–Ash (aka Fibbtrader)


General Market Review 08/14/2016

August 15, 2016

Markets went through another week of consolidation. This is the 4th week of consolidation with no clear conviction.

SPX: -.08%, COMP: .09%, DOW: -.20%, RUT: +.06%

So there’s nothing much to break into these charts other than to see whether there are any divergenes with internals. Lets look at all weekly charts

New highs on SPX tagged this week. Need to see whether it can continue this move higher.

2016-08-15_SPX_W

Nasdaq composite right at resistance from 2015 highs.

2016-08-15_COMP_W.png

Dow weekly at all time highs showing a W pattern target at 21206.

2016-08-15_DOW_W.png

RUT is the laggard and is well off from 2015 highs. While SPX and Dow are making all time highs RUT is catching up.

2016-08-15_RUT_W

Daily SPX shows some MACD divergence. Divergence at market tops are very common and take a long time to play out.

2016-08-15_SPX_D.png

90min chart of SPX showing the MACD divergence in detail. Price made higher highs while MACD made lower highs. Upper wedge could mark the interim top and make this pattern a complex triple top around 2200 area.

2016-08-15_SPX_90m.png

30m chart of SPX showing a inv H&S with neck line at 2188. Gap up over that area could see price move towards 2200 wedge resistance on both daily and 90 min. MACD also pinching and could resolve higher.

2016-08-15_SPX_30m.png

Looking at VIX, its right at the multi year support and its has bounced from this area of $10-$12. 10.28 is all time low of vix in 2014. We want to see VIx continue to go lower as market makes new highs. We see a divergence that market is making highs but VIX is not making new lows.

2016-08-15_VIX.png

Looking at VIX 90min chart, the wedge is broken now to upside with MACD confirming this move. This would confirm the divergence that markets are making highs whereas VIX is not confirming the move higher.

2016-08-15_VIX_90m.png

Here’s another correlation check between Dow Transports and Dow Jones industrial average. Transportations and DJIA both should be making new highs to confirm this bullish thesis. But Transportations are indeed making lower lows and lower highs.

Notice how on 2016 Feb lows DJIA made lower lows while DJT made higher low which led the DJIA price to move higher. So this is a caution to perma bulls that we need to exercise caution and not chase these new highs.

2016-08-15_DJI_DJT_Comp.png

Number of stocks making new highs in NYSE index. you want to see when markets are at all time highs you want to see some confirmation on new highs list as well. This is also another divergence on top of both VIX and DJT.

2016-08-15_NYSE.png

While markets are making new highs there are several divergences that’s shaping up and gets us to be cautionary. Play the price action and I’m expecting each dip will be bought and this top will be a very complex top and take a long time to play to down side.

FOMC meeting minutes could give that pop and drop to this market. So that’s something to watch out for this week.

HAve a good week and good trading!!